What If Your Business Report Told You What to Do Next?
A founder opens an analytics dashboard and sees that sign-ups are down. Stripe shows that new revenue also fell. An advertising platform reports more clicks than last week, while the support inbox contains several complaints about mobile checkout.
There is plenty of data. Yet one question remains: what deserves attention first?
Most business software is good at recording what happened. It gives us charts, tables, filters, and alerts. These are useful, especially when someone already knows what to investigate. For a small team without a dedicated analyst, however, the work begins after the dashboard loads. Someone must connect the changes, judge which ones matter, form explanations, and decide what to do.
I have been thinking about a reporting tool built around that missing step. It would connect to the sources a business already uses and produce a report every day, week, or month. The report would explain what changed, suggest why it may have changed, recommend concrete actions, and let the reader ask follow-up questions.
Concept note: I have not validated this idea with users. It is a product concept, not a claim that I have solved business reporting. Many of its hardest problems are about trust rather than software.
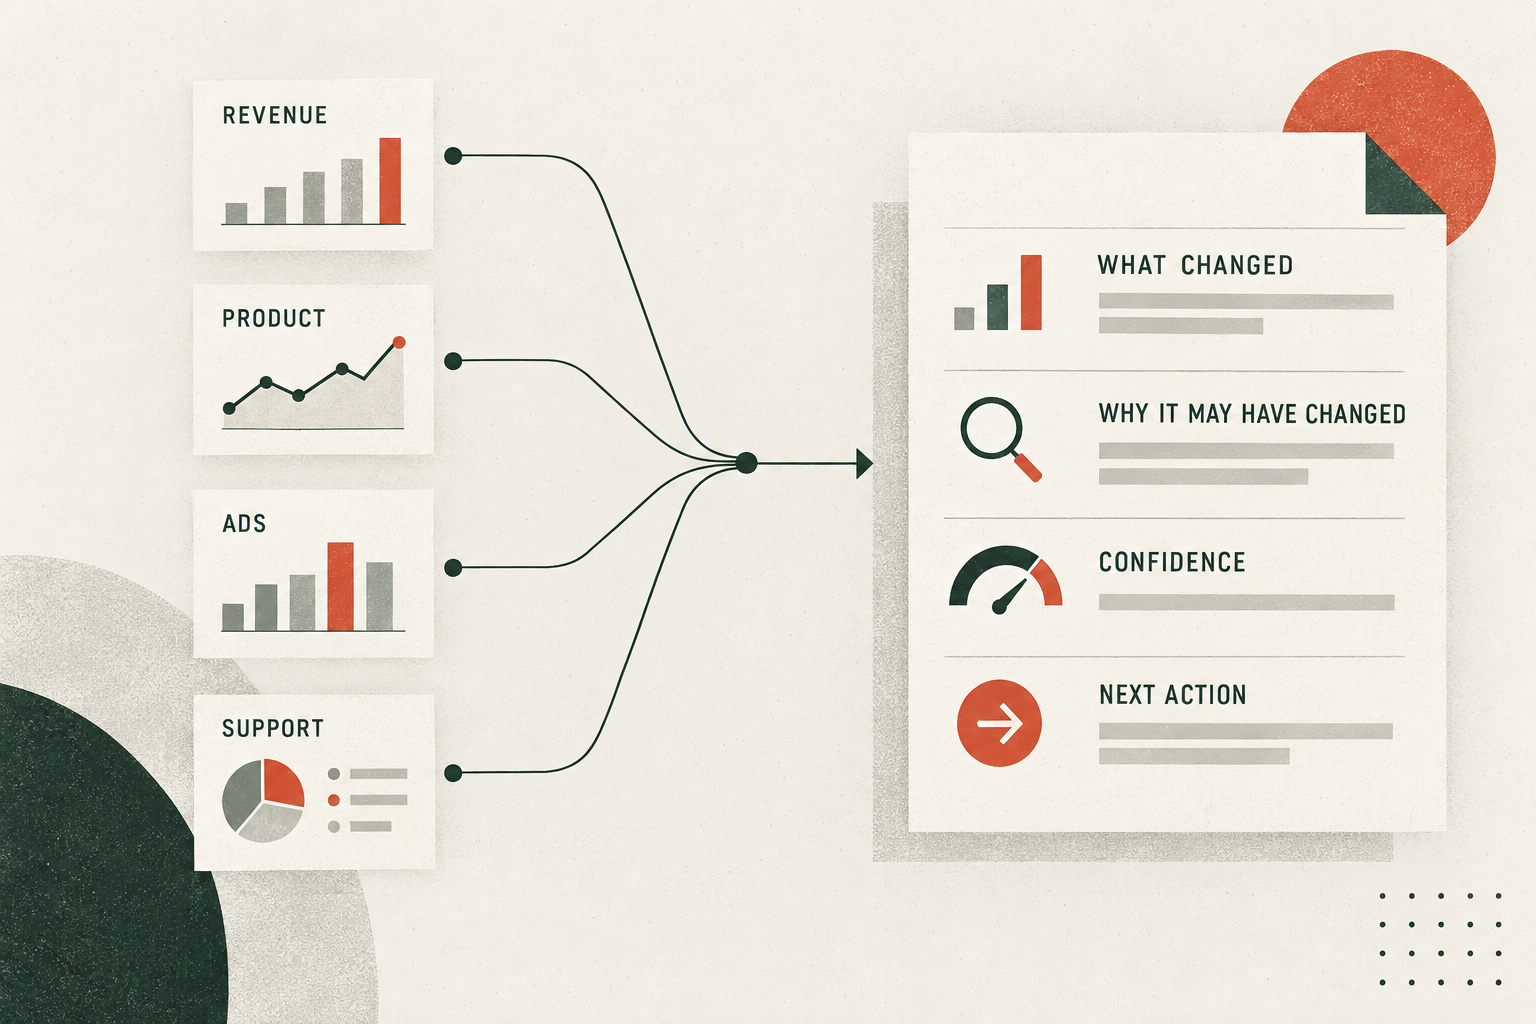
The useful output is not another collection of charts. It is a traceable path from scattered data to a decision.
From a status report to a decision brief
A normal report might say:
Trial-to-paid conversion decreased by 11% this week.
That is a measurement, not an explanation. It leaves the reader to search through acquisition channels, product events, billing data, releases, and customer messages.
A decision-focused report could continue:
Most of the decline came from mobile visitors arriving through Campaign B. Mobile checkout errors increased during the same period, shortly after Thursday's release. This does not prove that the release caused the decline. Check the affected checkout event and compare Campaign B's landing page on mobile before changing pricing or ad spend.
Now there is something to investigate. The report identifies the movement, narrows the affected segment, connects supporting evidence, admits what remains uncertain, and proposes a reversible next step.
The distinction matters. An attractive explanation can be more dangerous than an unexplained graph if the system presents a guess as fact.
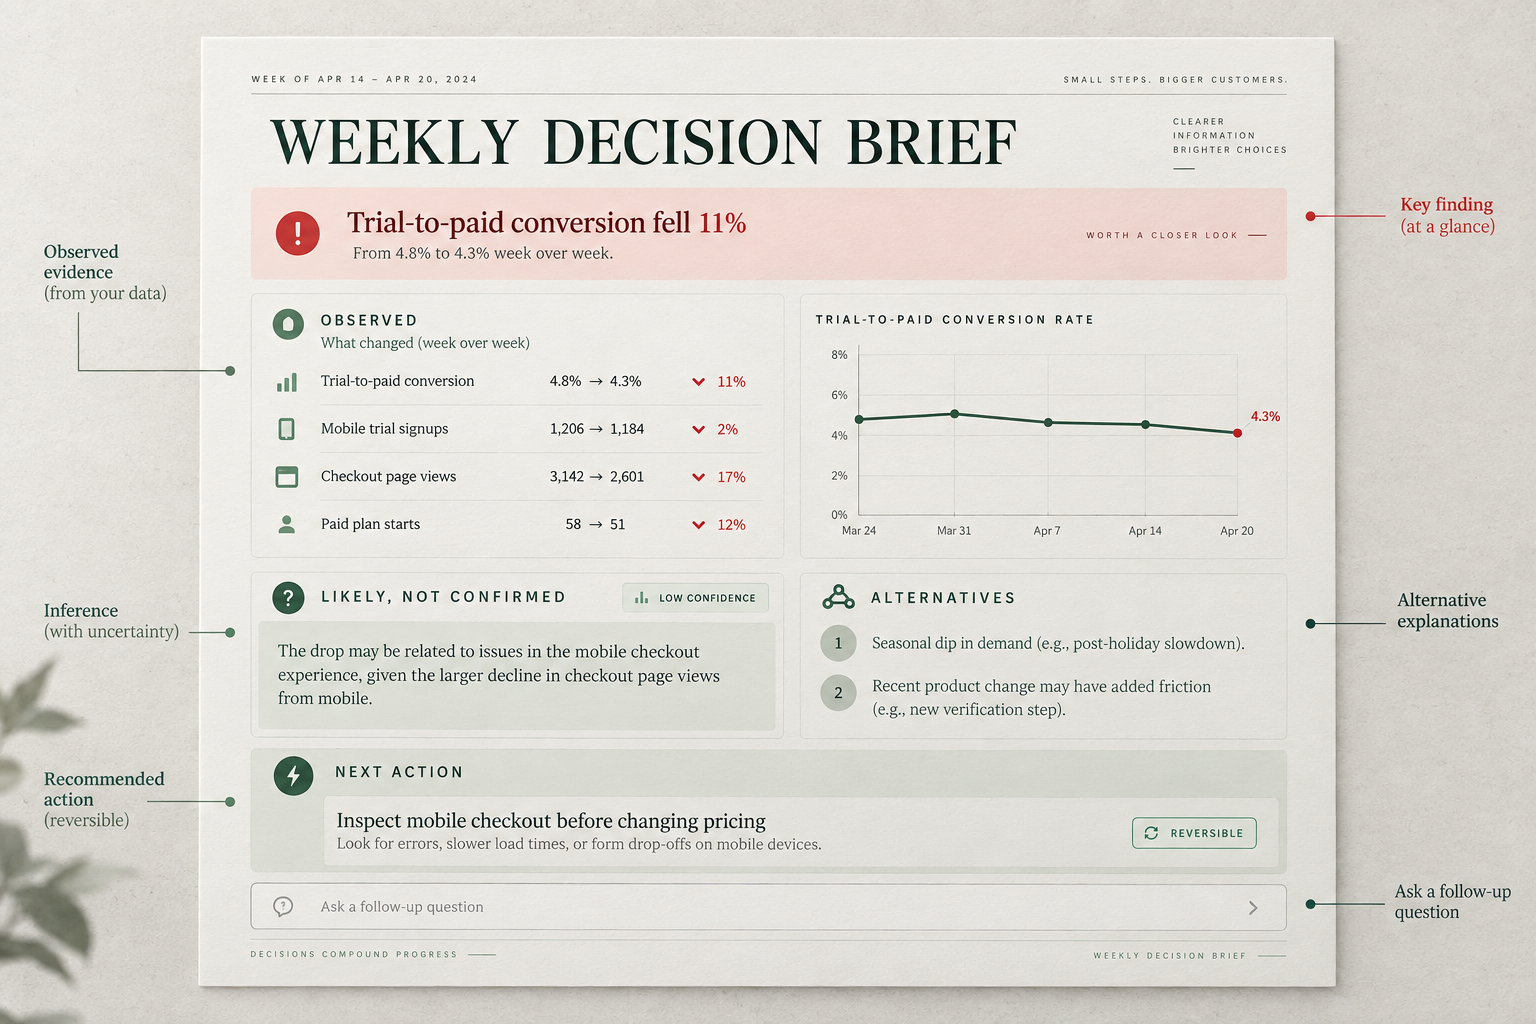
A recommendation becomes more useful when the reader can inspect its evidence, uncertainty, alternatives, and downside.
Every conclusion should carry its evidence
The report should visually separate four layers.
First are observations: revenue fell by a measured amount, checkout errors rose, or a campaign attracted a different mix of visitors.
Second are interpretations: the mobile release may have contributed to the decline.
Third are missing pieces: perhaps tracking broke, the comparison period included a holiday, or part of the sales process happens outside the connected systems.
Fourth are recommended actions. Each action should include its expected benefit, cost, urgency, downside, confidence, and the evidence that supports it.
A reader should be able to open any important statement and see the source, metric, segment, calculation, and comparison period behind it. Alternative explanations should appear beside the leading explanation instead of being hidden.
This would not make the report perfectly objective. Metrics are selected by people, tracking systems fail, and businesses contain important context that no integration can capture. Traceability would at least make the system's reasoning inspectable.
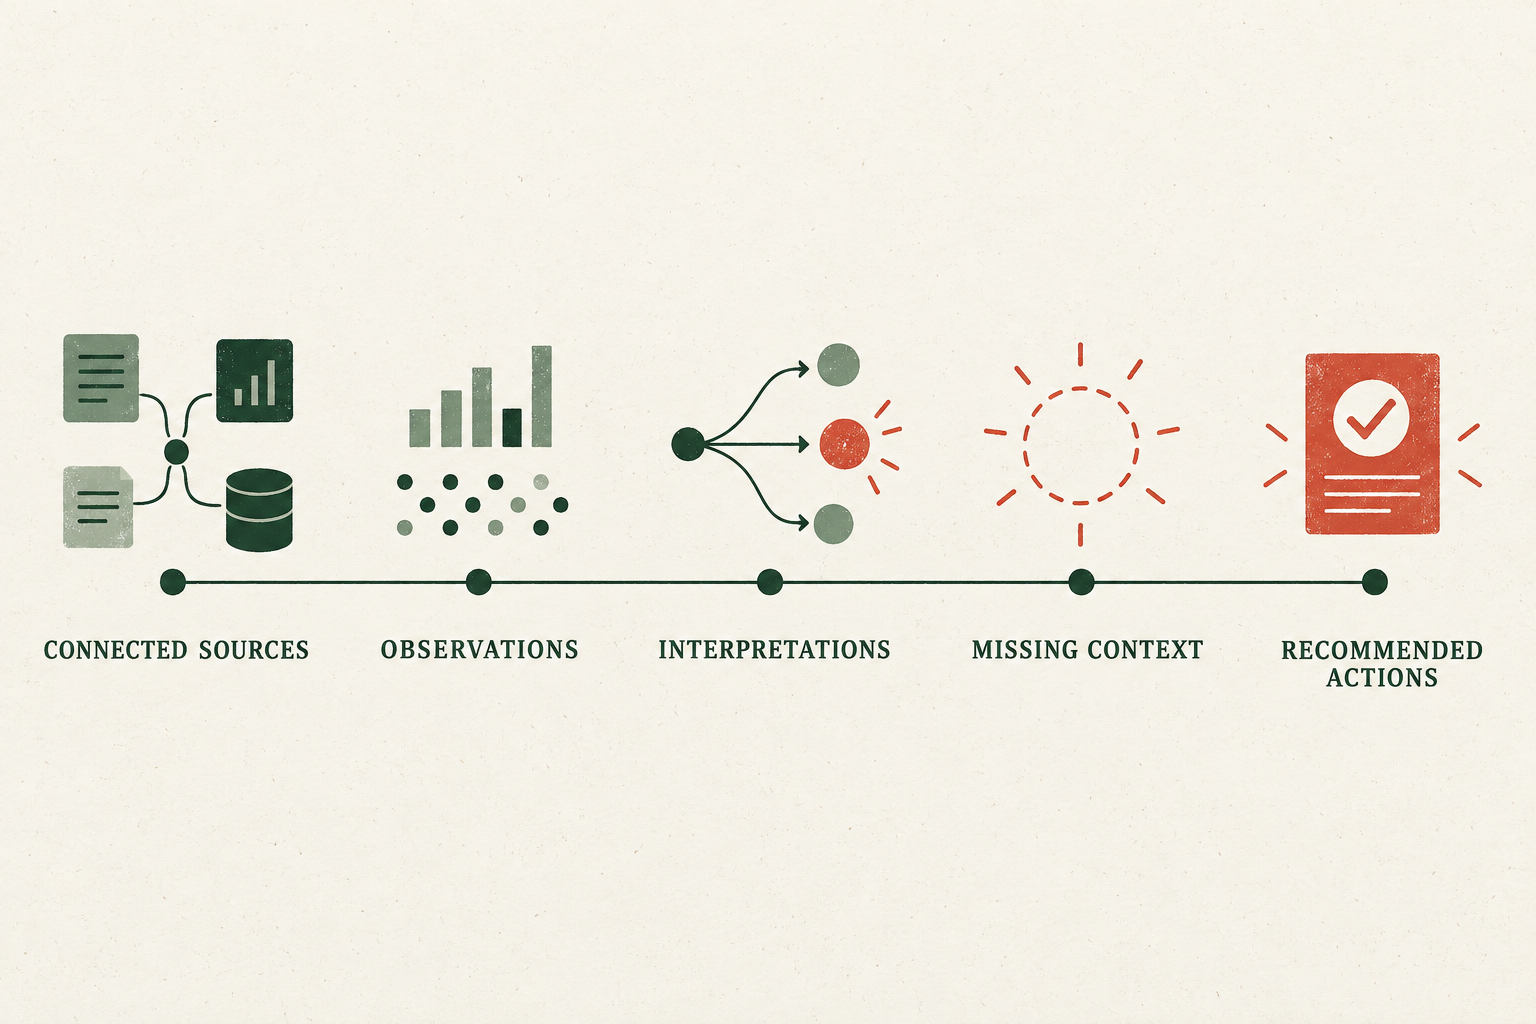
Interpretation and missing context must remain visible between measurement and action.
One engine, different reports
The underlying need appears in several kinds of business, but the product should not pretend they all operate the same way.
For a small SaaS company, the report might connect revenue, product analytics, acquisition, and support. It could focus on activation, conversion, churn, feature usage, and recurring revenue.
For an agency, it might combine advertising results, project delivery, budgets, and client goals. The report should explain performance in language a client can understand while showing the agency where intervention is needed. It could also reduce the repetitive work of collecting screenshots and rewriting numbers each week.
For an e-commerce operator, the important connections may sit between advertising, storefront activity, inventory, fulfilment, returns, and repeat purchases. A fall in sales means something different when traffic declined, a popular item went out of stock, or checkout started failing.
These could use the same reporting engine with different metrics, relationships, and report structures. I would still begin with one group. Supporting all three from the first version would likely produce shallow recommendations and a complicated setup.
My current preference would be small SaaS teams because their important systems are often digital and the feedback loop is relatively fast. That is only a starting assumption, not evidence that they need the product most.
A conversation attached to the report
A fixed report cannot anticipate every question. After reading about the conversion decline, a founder may ask:
- Did the change begin before or after the release?
- Is it limited to one browser or country?
- Have similar drops recovered without intervention?
- What is the least risky action we can test today?
The answers should remain attached to the same evidence. If the required information is unavailable, the system should say so and identify which source or event would be needed. A confident answer invented from incomplete data would defeat the purpose.
This is where AI would probably help, but I would not present the product as another AI analyst. Models can summarize information, translate questions into queries, identify patterns, and generate explanations. The user-facing promise is simpler: understand what changed and decide what to investigate or do next.
Recommendations without autopilot
I want the report to recommend concrete actions. “Monitor the situation” is safe but rarely useful. A recommendation could be to inspect a release, repair a campaign's mobile landing page, contact customers who encountered an error, or run a limited test before making a larger change.
I would stop before automatic execution. Pausing an advertisement, changing a price, or contacting customers can affect money and trust. The system may lack offline context, misunderstand a business constraint, or mistake correlation for causation.
The better role is decision support: propose the action, show the case for it, expose the downside, and let a responsible person decide.
The questions that matter now
The technical demo is easy to imagine. Connect several APIs, generate a polished report, and add a question box. That would not prove the report improves decisions.
The real test is whether operators repeatedly discover something useful, understand why the system recommended an action, and make a better or faster decision because of it. It also matters whether connecting the data is worth the setup, whether businesses trust a system with sensitive information, and whether its suggestions remain useful after the novelty disappears.
I keep returning to the same thought: businesses may not need another place to look at their numbers. They may need a better way to move from numbers to questions, and from questions to careful action.
The first experiment should therefore be narrow. Take one kind of small business, connect a few important sources, and manually produce the report alongside the software. Then ask whether it found anything the operator would otherwise have missed.
If it cannot change a decision, it is only a prettier dashboard.
If you run a SaaS company, agency, or e-commerce business, I would like to know: what decision did your dashboards fail to help you make recently?